The month has closed. The dining room was full most nights, and the bank account doesn't show it. The number behind that gap is your net profit margin: what's left of revenue once every cost for the month is paid. At a 3% net margin, a single cost line rising by two points of revenue takes two thirds of the profit. There are two margins worth working out, and they answer different questions. Gross margin looks at one dish and what's left of its price after the ingredients. Net margin looks at the whole month and tells you whether the business made money.
Gross margin is about a plate, net margin is about the month
Gross margin starts from one menu price. Subtract what the ingredients on that plate cost you, then divide by the price. Rent and wages are left out on purpose, so the dish is judged on its own.
Net margin starts from the whole month's revenue. Subtract every cost paid in that month, then divide by revenue. Food, wages, rent, energy, card fees, delivery commissions, software and waste all go in.
Here's a made-up example. A pasta sells for 18 and its ingredients cost 5. Gross profit is 13, a gross margin of about 72%. In the same month the restaurant took 60,000 and paid out 58,200. Net profit is 1,800, a net margin of 3%.
Both numbers can be right at the same time. The pasta earns well per plate, and the month was still thin. Reworking the pasta recipe won't close that gap on its own. A menu full of high-margin dishes can still lose money if guests order something else.
And 3% leaves very little room. Say food cost goes up by two points of revenue that month. That's 1,200 more on the supplier invoices. Two thirds of the profit is gone before a single price has changed.
Why we don't give you an industry average to aim at
Search for restaurant profit margins and you'll find ranges of net margin, often split by restaurant type. We've left those figures out. They rarely say how the costs behind them were counted, and without that you can't fairly hold your own margin up against them.
Take two restaurants run exactly the same way. One owner draws a salary through payroll. The other takes whatever is left at year end. One restaurant pays rent at market rate. The other owns the building and books no rent. One records delivery orders at menu price and lists the platform's commission as a cost. The other records only what the platform pays out. On paper their net margins can end up points apart, and neither is better run.
A fairer comparison is your own margin against the same month last year, worked out the same way both times. The first time you do it, note how you handled owner pay, rent and commissions. That way next year's calculation matches this one.
Prime cost: the monthly check with a threshold behind it
Prime cost is your food and beverage cost plus your labor cost. These are the two lines that move with how you run service. The accounting firm Bennett Thrasher, in its Q&A on typical restaurant profit margins, says prime cost is ideally kept under 55% to 60% of revenue. Once it creeps higher, the same page says, profitability becomes difficult.
The ceiling matters because of what comes after it. Rent, energy, insurance, software and repairs are mostly fixed amounts, and they're paid out of whatever prime cost leaves. In the example month, prime cost is 35,400, which is 59% of the 60,000 taken. That leaves 24,600. The other costs take 22,800, and 1,800 is profit. Now let prime cost reach 38,000 on the same revenue. Only 22,000 is left. The other bills haven't moved, so the month closes 800 down.
Count labor the way you actually pay it, employer contributions included. Then count it the same way every month. If prime cost jumps because you changed what goes into it, the jump says nothing about the kitchen or the floor.
The 30/30/30 rule, and the month it stops working
30/30/30 is a rule of thumb. In the version usually quoted, food cost, labor and overhead each take about 30% of revenue, and the last 10% is profit. The first two parts say roughly what the prime cost ceiling says, since 30 plus 30 is 60.
It's the third 30 that breaks. Overhead is mostly bills, and most bills stay the same in a slow month. Say rent, energy and your other fixed costs come to 18,000 a month. At 60,000 of revenue that's exactly 30%. With food and labor at 30% each, profit is 6,000. In a 50,000 month the same bills are 36% of revenue. Food and labor can hold at 30% each, and profit still drops to 2,000.
The more useful number is the revenue a month needs just to cover those bills. With food and labor at 60% of revenue, 40% of every sale is left for fixed costs. So 18,000 of overhead needs 45,000 of revenue to break even. That assumes labor really falls with sales. In a quiet week, scheduled hours may not drop as fast as covers do. Any labor that stays pushes break-even higher.
Use the rule for food and labor, the lines you can steer shift by shift. Track overhead as the fixed amount it is each month, not as a share of revenue.
Which type of restaurant is most profitable
Being a café, a bar or a cloud kitchen doesn't make a restaurant profitable by itself. We haven't found a published ranking by format with a method we could check, so we won't rank them. What we can do is point to where each format's margin tends to be exposed. Often a format that cuts one cost line pays for it on another.
A full-service restaurant pays floor and kitchen staff for the whole service, and the length of a meal limits how often a table turns. Quick service and fast casual need less floor labor. In exchange they need more transactions at a lower ticket to cover the same rent. A café or bakery works on a small ticket per seat and writes off the bakery stock left unsold at close. In a bar, pour control and late-hour staffing have a big say in the margin. A cloud kitchen has no dining room to staff, and it pays commission on every delivery order. Our guide to renting and running a cloud kitchen goes through that trade.
If you're choosing between formats, run the example month for each one with your own rent, expected ticket and staffing. Then compare the break-even revenue each one needs. That comparison rests on your numbers. A ranking wouldn't.
Four things move the margin, and they aren't equally easy
Price lifts gross margin per plate from the day you change it, as long as guests keep ordering. It's also the lever guests notice. An across-the-board increase moves the cheap dishes too, and some guests judge the whole menu by those.
Cost is the lever guests mostly don't see, so it carries the least risk with them. It's slow work, though: supplier terms, portioning, waste, prep planning, stock counts. Portion size is the exception. Guests notice a smaller plate, and complaints about it can cost more than the saving.
Mix is which dishes actually get ordered. Your gross margin for the month is the weighted average of everything sold. Sell ten more of your highest-margin dish and ten fewer of your lowest, and the month changes. No price went up and no supplier was called.
Volume spreads the same fixed costs over more covers. In the example, the month has to clear 45,000 of revenue. A half-empty Tuesday and a Saturday where you turn people away are two different problems in the same room. The seven revenue management strategies cover both. Practical ways to raise daily customer counts starts with the quiet days.
Mix is the lever a sales report hides
A supplier price rise shows up on an invoice. A slow Tuesday you can see from the door. A dish that has slowly stopped selling gives no signal like that, and it still pulls the month's margin down.
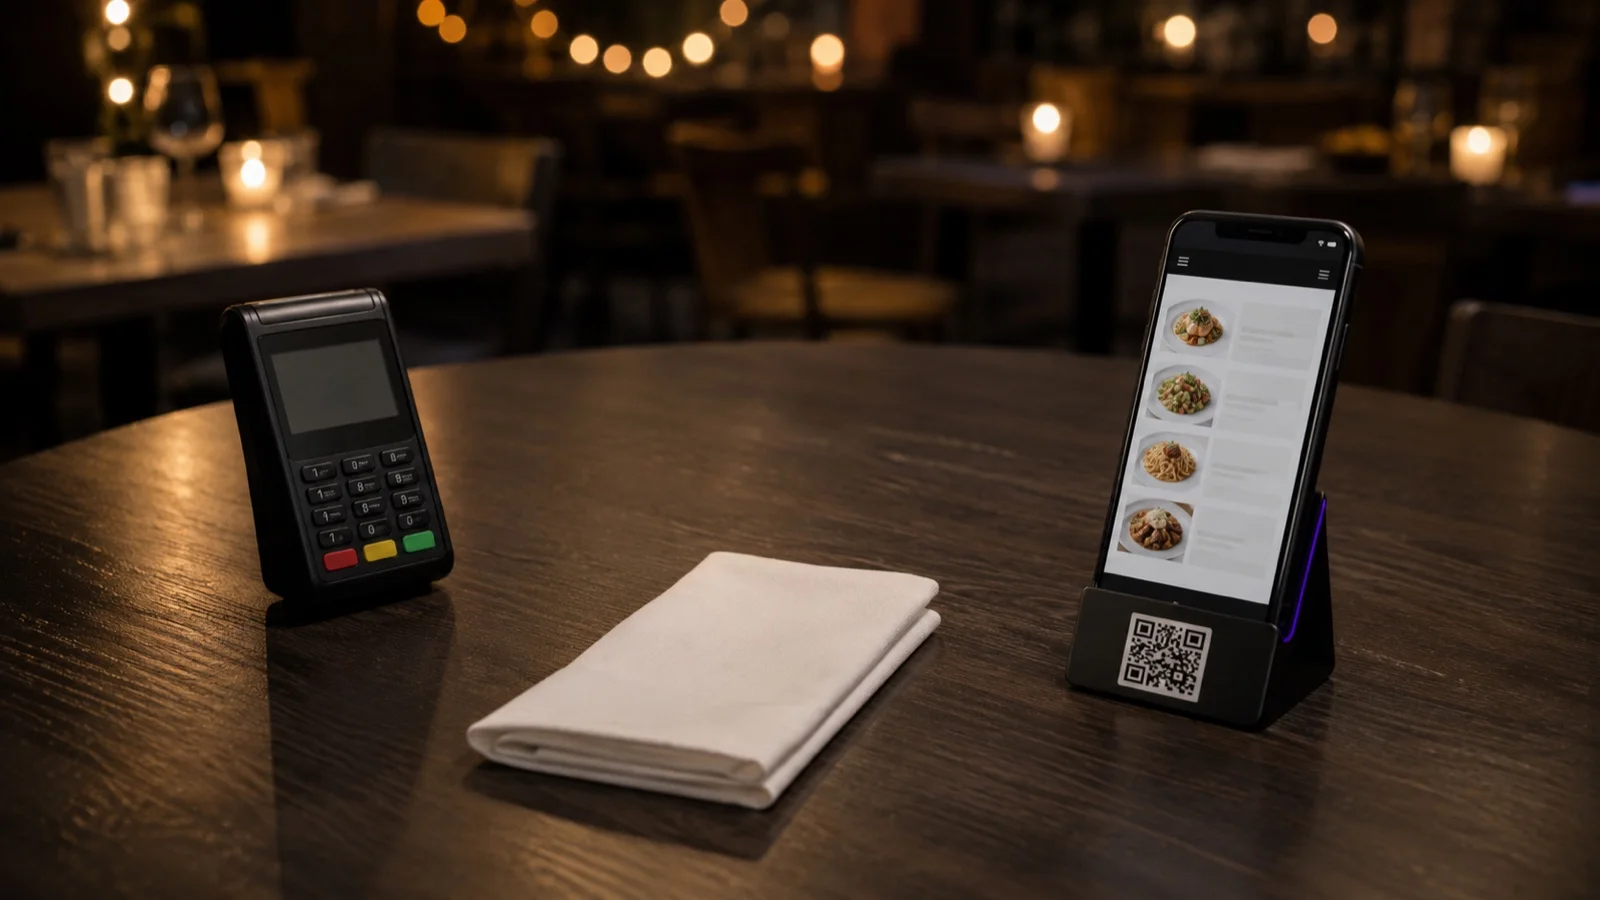
A digital menu records something a printed menu can't: which sections and items guests opened. Put those views next to each dish's orders, and a slow dish turns out to be one of two different cases.
Rarely seen and rarely ordered often points to visibility. The dish may sit in a section few guests scroll to, or at the bottom of a long list. Moving it costs little, so try that first.
Often seen and rarely ordered is a different problem. Guests find the dish and choose something else, so moving it probably won't help. Look at the description, the photo and the price instead. A sales report shows both cases as the same low number. That makes it easy to fix the wrong thing.
Here's an invented case. The numbers don't come from any restaurant. Last month's report shows the lamb, your highest-margin main, viewed 1,100 times and ordered 40 times. The burger earns less per plate. It was viewed 900 times and ordered 310 times. Guests are finding the lamb and passing on it. Say its description is one line against the burger's three, and it has no photo. That gives you a likely cause and something specific to test. The sales report alone would only have shown a main that doesn't sell.
What FineDine IQ shows you, and what you still work out yourself
If your menu runs on FineDine, you don't need a spreadsheet to put views against orders. FineDine IQ is the AI Reports section of the panel, and it's updated hourly. Its metrics include Item Views and Section Views alongside Orders, Revenue and Avg Ticket, and it has a Menu Performance tab. You can look at 7, 14, 28 or 90 days, or a custom range, shown as a comparison. The Actions list suggests specific fixes. Items missing photos and hidden bestsellers are among its examples.
There are two limits to know before you plan around it. None of the eight metrics is a cost, so gross margin, prime cost and net margin still come from your supplier invoices and payroll. Views also only come from the digital menu. A table that orders on a server's recommendation, or from a printed menu you still keep, adds orders with no views behind them. The ratio is most reliable for dishes and services where most guests order from the QR menu.
Four numbers to work out for last month
Start with last month, since its invoices and payroll are already in. Before you calculate anything, write down how you counted owner pay, rent and delivery commissions. Every later month then gets worked out the same way. Four numbers are enough for a first pass: net margin, prime cost, break-even revenue, and views against orders for each dish.
| Number | How to work it out | Where the figures come from | What it tells you |
|---|---|---|---|
| Net margin | Revenue minus every cost paid in the month, divided by revenue | Sales records, supplier invoices, payroll, rent and other bills | Whether the month made money, compared with the same month last year counted the same way |
| Prime cost | Food and beverage cost plus labor cost, divided by revenue | Supplier invoices and payroll, employer contributions included | Whether the two lines you steer shift by shift sit under the 55% to 60% ceiling |
| Break-even revenue | Fixed monthly bills divided by the share of revenue left after food and labor | Rent, energy, insurance, software, repairs | The revenue a month needs before any profit. 18,000 of bills at 60% food and labor needs 45,000 |
| Views against orders per dish | Item views next to orders for the same period | Digital menu report | Whether a slow dish is hard to find, or found and passed over |
Frequently Asked Questions
- What is Chick-fil-A's profit margin?
- We couldn't find a sourced figure for a single Chick-fil-A restaurant's margin, so we don't quote one. Be careful with any margin you see for a franchise chain. A company-level figure can include franchise fees and other income that a single restaurant never sees.
- Which business has a 50% profit margin?
- In a restaurant, 50% is usually a gross margin figure. A dish or a drink reaches it when its ingredients cost less than half its menu price. A 50% net margin would need food, labor, rent and every other bill combined to stay under half of revenue. A restaurant with prime cost near 55% is already past that before rent.
- Should my own salary count as a cost?
- If you work in the business, yes. Put the wage you'd pay someone else for your role into labor. Otherwise the margin describes a restaurant that only works because its owner goes unpaid. It also won't compare with a month when you hire someone to cover your shifts.
- Where do delivery platform commissions go in the calculation?
- Record the order at the price the guest paid, and the commission as a cost. If you take the commission out of revenue instead, you divide by a smaller revenue figure and the margin looks higher. You also lose sight of what each delivery order really costs you.
- Should I calculate margin monthly or weekly?
- Net margin monthly, since rent and most bills run monthly. Food cost and labor are worth a weekly look if your invoices and schedule make that practical. Those lines can drift within a month.